📊 Baldwin County Housing Market Report – March 2026
Baldwin County’s real estate market remained active in March 2026, with increased sales activity across both the resort and traditional residential markets compared to the same time last year. As the spring market begins to take shape, year-over-year data shows rising closed sales, shifting pricing trends, and continued inventory growth.
According to data from the Baldwin REALTORS® Multiple Listing Service (MLS), both segments of the market are seeing steady movement, with notable differences between coastal and inland areas.
🏖 Resort Area Market Overview
(Includes Orange Beach, Fort Morgan, and Gulf Shores south of Canal Road / AL-180)
The resort market saw increased sales activity in March, even as pricing and market timing shifted slightly.
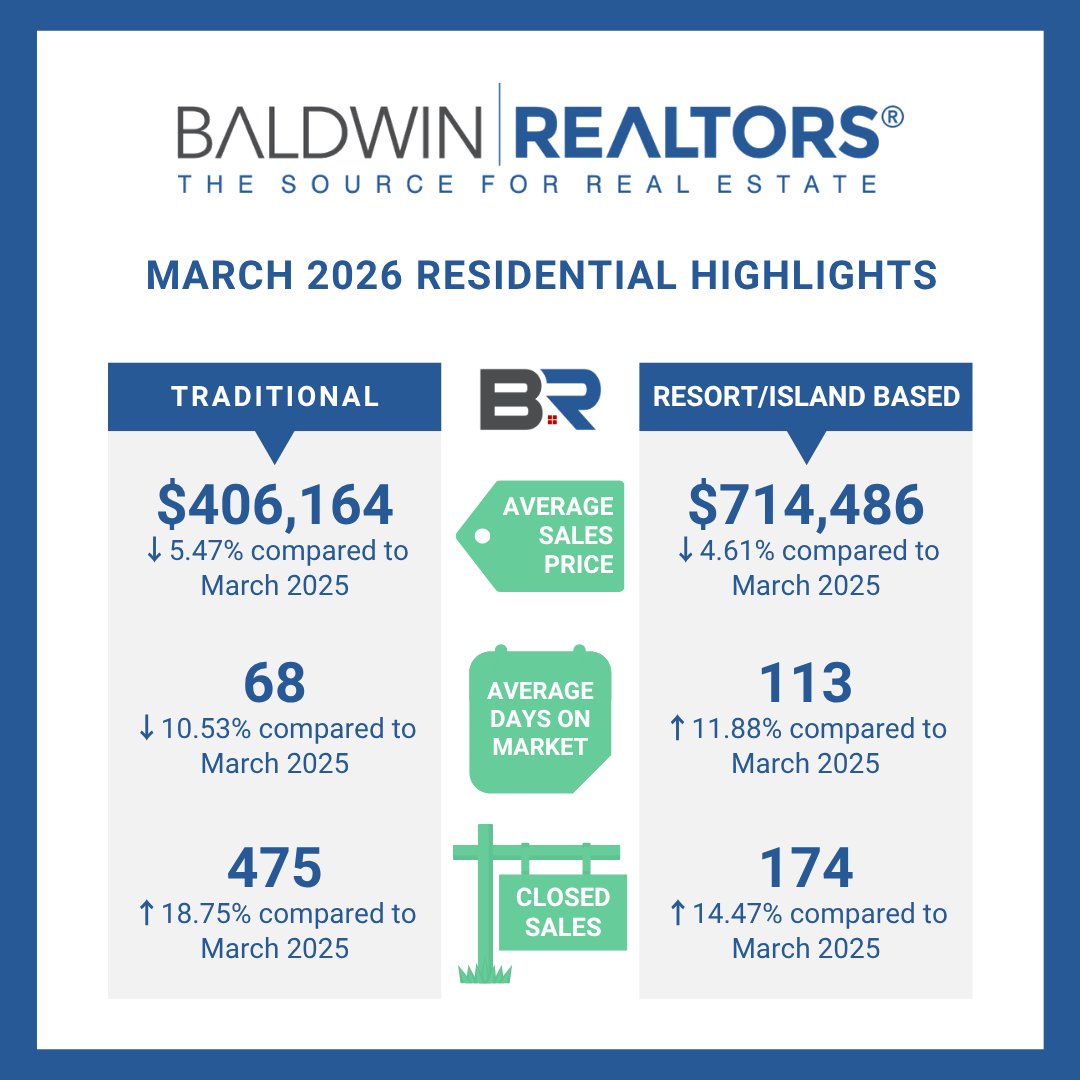
💰 The average sales price was $714,486, down from $749,049 in March 2025
⏱ Days on market increased to 113 days, up from 101 days
📈 Sales activity increased:
- 174 properties sold in March 2026
- 152 properties sold in March 2025
💵 Total sales volume rose to $124,320,660, up from $113,855,522 last year
📉 New listings declined:
- 397 new listings in 2026
- 480 new listings in 2025
🌴 Resort Land Market
📍 Land Parcels Sold: 19 (vs. 20 last year)
💰 Total Sales Volume: $6,348,900 (up slightly from $6,168,900)
📊 Average Price: $334,152 (up from $308,445)
⏱ Days on Market: 146 (improved from 195 days)
📈 New listings increased slightly from 26 to 28 parcels
🏡 Traditional Residential Market Overview
The traditional residential market saw strong gains in sales activity and improved market speed.
💰 The average sales price was $406,164, down from $429,684 in March 2025
⏱ Homes sold faster, with days on market decreasing to 68 days (from 76 days)
📈 Sales activity increased significantly:
- 475 properties sold in March 2026
- 400 properties sold in March 2025
💵 Total sales volume reached $192,928,287, up from $171,873,608
📋 Inventory increased:
- 751 new listings in 2026
- 699 new listings in 2025
🌱 Traditional Land Market
📈 Land sales showed increased activity and faster turnaround times.
📍 Land Parcels Sold: 75 (up from 57)
💰 Total Sales Volume: $12,118,800 (up from $10,844,377)
📊 Average Price: $161,584 (down from $190,252)
⏱ Days on Market: 148 (improved from 167 days)
📈 New listings increased from 155 to 191 parcels
📍 Residential MLS Statistics by Area
Central Baldwin
🏡 Properties Sold: 209
💰 Average Price: $335,883
⏱ Days on Market: 68
📈 Price Change: ↑ 6.10%
Coastal Condominiums
🏢 Properties Sold: 105
💰 Average Price: $637,508
⏱ Days on Market: 132
📉 Price Change: ↓ 0.55%
Coastal Homes
🏠 Properties Sold: 100
💰 Average Price: $726,783
⏱ Days on Market: 81
📉 Price Change: ↓ 7.10%
Eastern Shore
🌅 Properties Sold: 214
💰 Average Price: $465,453
⏱ Days on Market: 69
📉 Price Change: ↓ 15.78%
North Baldwin
🌾 Properties Sold: 31
💰 Average Price: $374,659
⏱ Days on Market: 49
📈 Price Change: ↑ 2.65%
💡 What This Means for Buyers and Sellers
March data shows a healthy and active spring market across Baldwin County.
🏖 Coastal markets are seeing strong demand but slight price adjustments, giving buyers more opportunity compared to previous years.
🏡 Traditional residential areas are showing increased sales activity and faster transactions, signaling continued buyer confidence.
📊 With inventory rising and pricing adjusting in some areas, both buyers and sellers have opportunities—but strategy and local knowledge matter more than ever.
📚 Source
Market statistics provided by the Baldwin REALTORS® Multiple Listing Service (MLS) – March 2026 Housing Report.